View Monitoring Session Statistics
The Monitoring Session Statistics page lets you analyze the incoming and outgoing traffic on an hourly, daily, weekly, and monthly basis. The traffic can be viewed based on kilobits/second, megabits/second or gigabits/second.
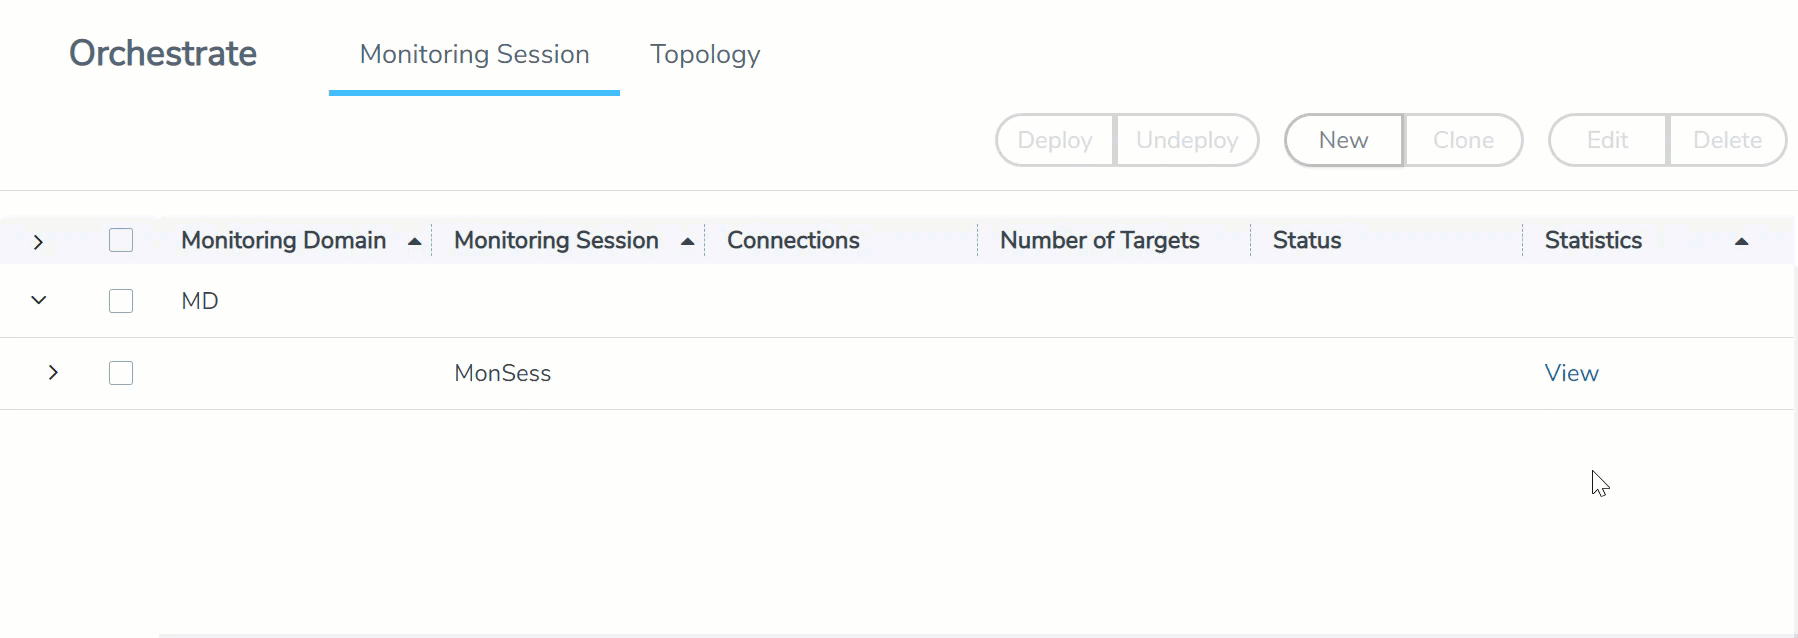
On the Monitoring Sessions page, click View in the Statistics column to view the Monitoring Session Statistics page. The Monitoring Session Statistics page appears where you can analyze incoming and outgoing traffic.
Note: If there are multiple monitoring sessions with different target selection, then the incoming maps will not show true statistics and it shows the aggregate traffic from all the targets.
You can also perform the following actions on the Monitoring Session Statistics page:
- Directly below the graph, you can click on IncomingMbps, Outgoing Mbps, or Ratio (Out/In) (Mbps) to view the statistics individually.
- At the bottom of the Monitoring Session Statistics page, you can click on
View Monitoring Session Diagram. The Monitoring Session Diagram quick view appears. - On the Monitoring Session Diagram page, you can expand any map, or tunnel to open a Details quick view of that item to see more details about the incoming and outgoing traffic for that item.
- You can also scroll down the Map Details quick view to view the Map Rules, Action Sets, and Map Info for this map. You can select Map Rules or Action Sets to view the traffic matching the selected rule on the graph in the quick view.
- You can also view the statistics of the monitoring session deployed in the individual V Series Nodes. To view the statistics of the individual V Series Node, select the name of the V Series Node for which you want to view the statistics from the V Series Node drop-down menu on the top left-corner of the Monitoring Session Statistics page.
- Hover over the V Series Node drop-down to view the number of the applications, end points, and other application environments configured for a particular V Series Node. It also displays the error message related to configuration for the particular V Series Node.


