Observability Gateway Application
The
To configure an
| Step No | Task | Refer the following topics |
|---|---|---|
|
1 |
Create a Monitoring Domain |
Create Monitoring Domain topic in the respective GigaVUE Cloud Suite Configuration Guides. |
|
2 |
Deploying GigaVUE V Series Node Note:
|
Configure GigaVUE Fabric Components in GigaVUE‑FM topic in the respective GigaVUE Cloud Suite Configuration Guides. |
|
3
|
Note: This V Series Node is used for creating Application Intelligence Session.
|
Configure Application Intelligence Solutions on GigaVUE V Series Nodes topic in the respective GigaVUE Cloud Suite Configuration Guides. |
|
4 |
Add Application Metadata Intelligence Session |
Create Metadata Intelligence by Editing Monitoring Session from Dashboard |
|
5 |
Create a Monitoring Session |
Create Monitoring Session topic in the respective GigaVUE Cloud Suite Configuration Guides. |
|
6 |
Add Applications to the Monitoring Session |
Add Application to the Monitoring Session topic in the respective GigaVUE Cloud Suite Configuration Guides. |
|
7 |
View Monitoring Session Statistics |
View Monitoring Session Statistics topic in the respective GigaVUE Cloud Suite Configuration Guides. |
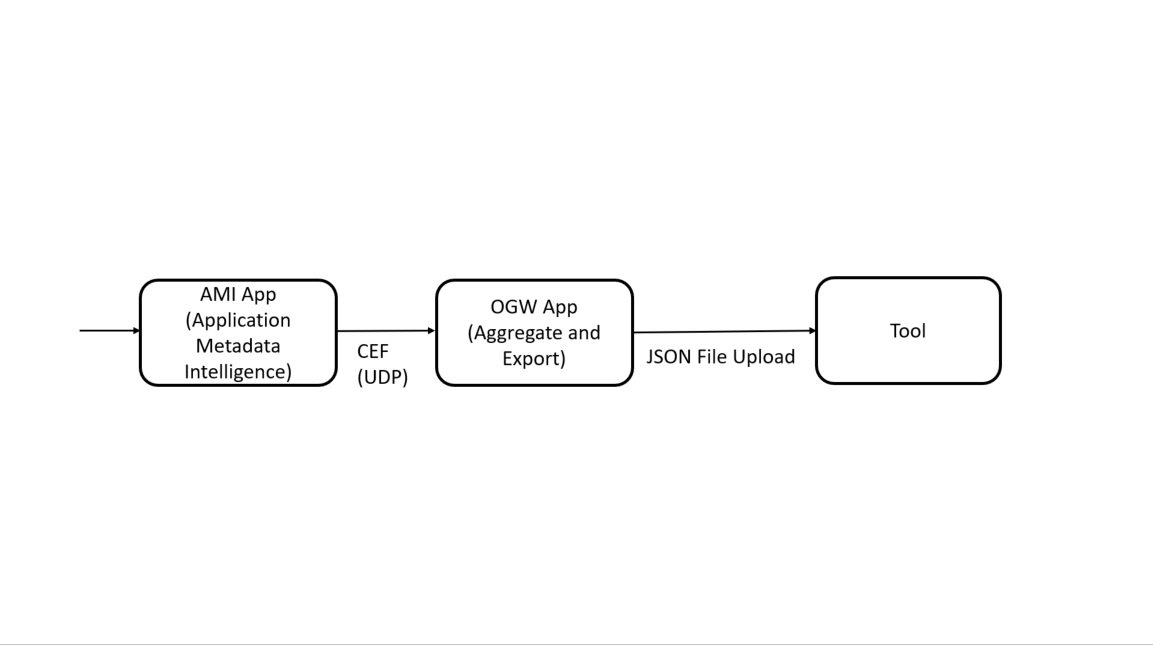
OGW Application Deployment
| Hardware |
| Virtual (VMware) |
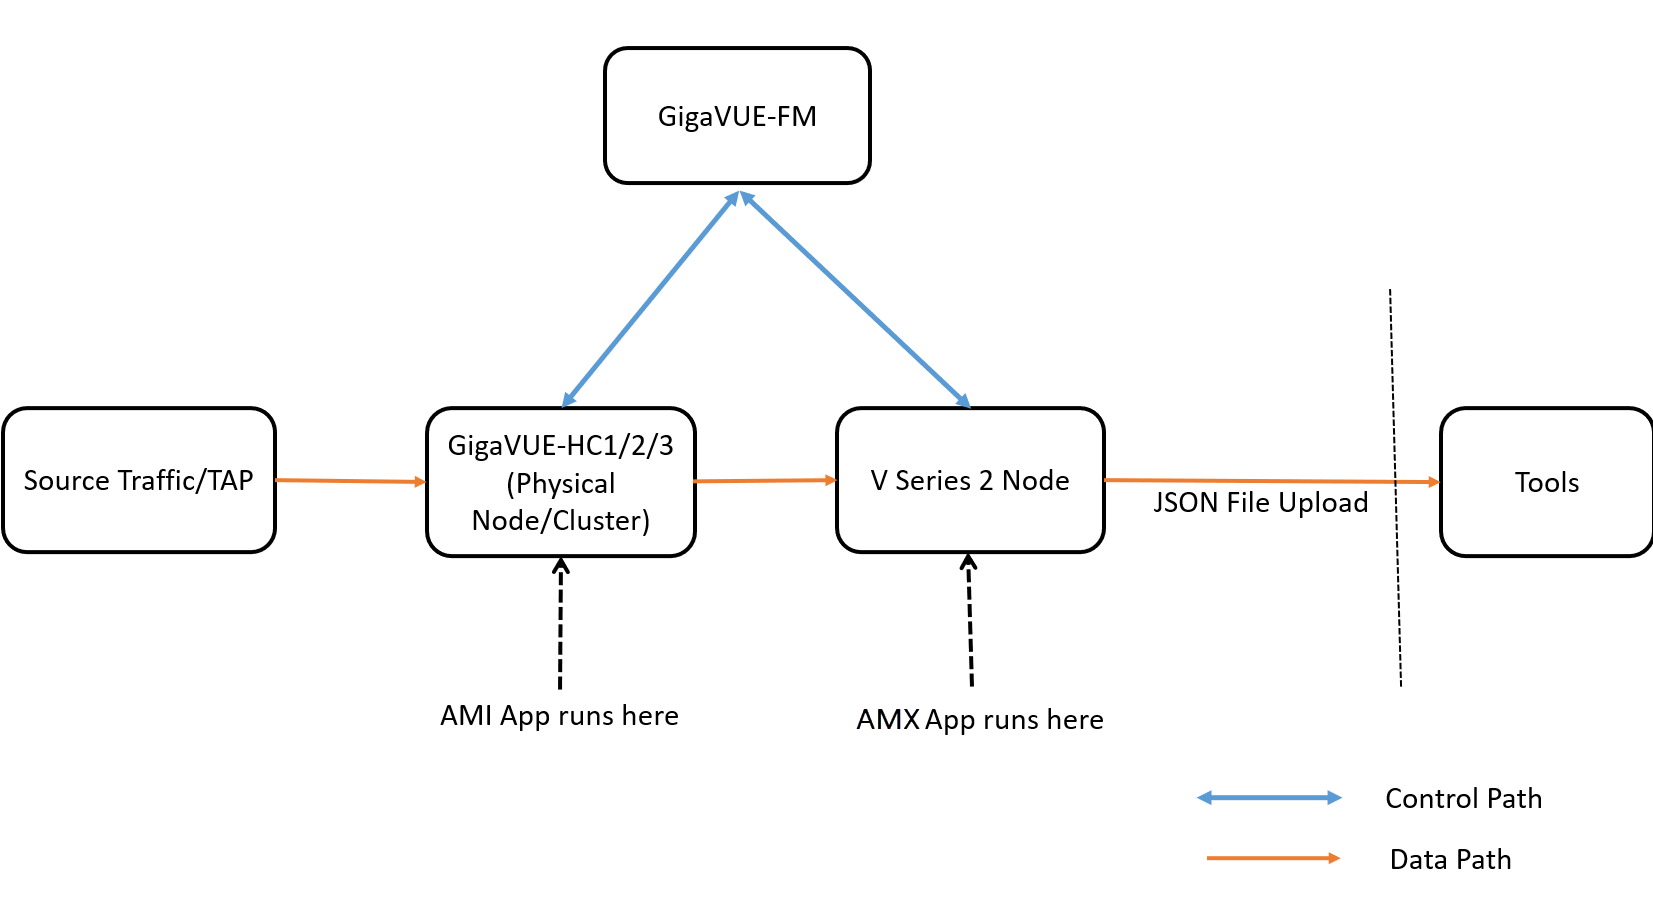
On-Premises
Hardware
In hardware deployments, the Application Metadata Intelligence (AMI) runs on a physical node/cluster, and the
- GigaVUE-HC1
- GigaVUE-HC2
- GigaVUE-HC3
- GigaVUE‑HC1-Plus
Private Cloud (VMware)
In the Private Cloud environment, the application is supported only on VMware and can be deployed in the VMware as shown in the diagram.

Note: The application is not supported on Nutanix or OpenStack environment.
Public Cloud
In the Public Cloud environment, the application is supported on AWS and Azure platforms, and can be deployed as shown in the diagram: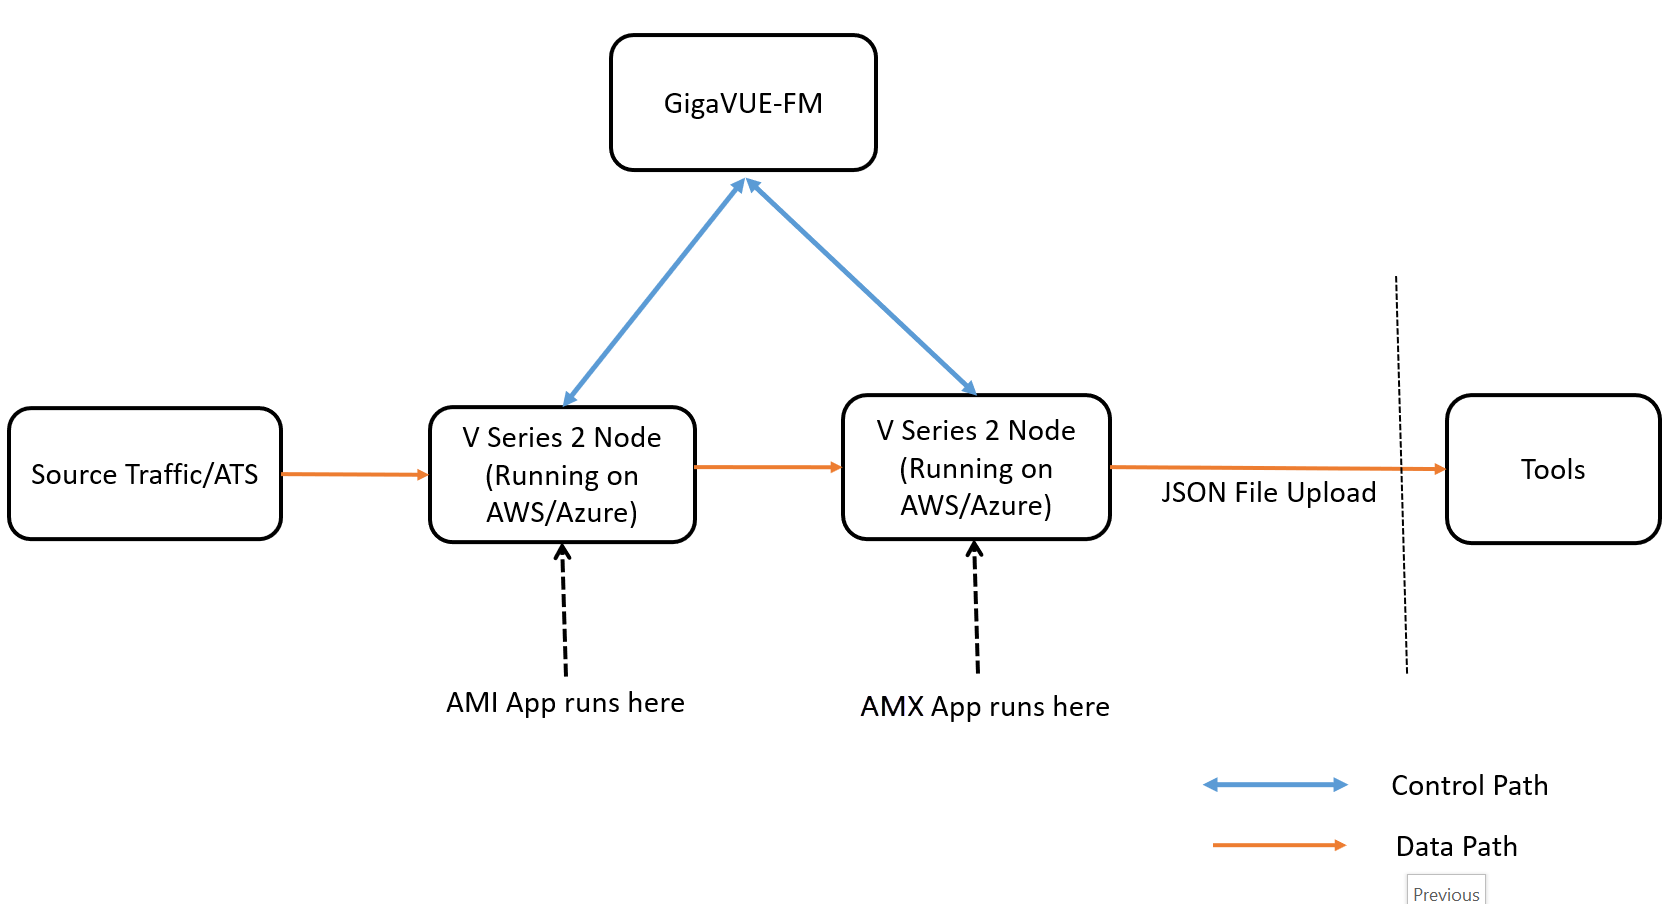
Rules
- After deploying the GigaVUE V Series Node in the monitoring domain, click on the GigaVUE V Series Node's Name, and the V Series Node quick view opens. Choose a data IP to which you wish to send CEF packets, then use the IP address of this data IP as the Tool IP Address when creating the Application Metadata Intelligence solution. Refer
to Create Metadata Intelligence by Editing Monitoring Session from Dashboard
topic in the GigaVUE Fabric Management Guide on how to configure AMI for
- The GigaVUE V Series Node deployed must be entirely dedicated to the
Prerequisites for AWS
Prerequisites to follow when creating a monitoring domain and deploying a V Series node:
- Select Traffic Acquisition Method as None. Refer Create a Monitoring Domain for more detailed information on how to create a monitoring domain.
- Select Instance type with three or more NICs. Refer Configure and Deploy GigaVUE Fabric Components in GigaVUE-FM for more detailed information on how to deploy a GigaVUE V Series Node.
- When the Traffic Acquisition Method is selected as None, the Volume Size field appears on the AWS Fabric Launch Configuration page. Enter the Volume Size as 80GB.
Note: Check on the disk space run every 30 minutes and when the disk space reaches 50%, purge starts.
Prerequisites for Azure
Prerequisites to follow when creating a monitoring domain and deploying V Series node:
- Select Traffic Acquisition Method as None. Refer Create Monitoring Domain for more detailed information on how to create a monitoring domain.
Configure Observability Gateway Application Application
Rules to follow when using the
The monitoring session can only have Raw End Point (REP), it cannot have other applications, maps, or tunnels when using the
To add
- Drag and drop
- Enter the Alias for the application.

- Enter the following details for the Cloud tool export in the Application quick view:
Click Add. Enter the following details:
o Enter the Key . o Enter the Value. Note: When New Relic is selected as the cloud tool, ensure that the key is eventType and the Value can only have alphanumeric characters, colons ( : ), periods ( . ), and underscores ( _ ).
- Click Deploy to deploy the monitoring session. The Select nodes to deploy the Monitoring Session dialog box appears. Select the GigaVUE V Series Node for which you wish to deploy the monitoring session.
- After selecting the V Series Node, select the interfaces for the REPs deployed in the monitoring session from the drop-down menu. Then, click Deploy.
Note: If you reload the GigaVUE V Series Node after configuring the AMX application, then the Ingestor in the AMX application fails.
The monitoring session configuration health can be viewed on the Monitoring Session page. Refer Cloud Health Monitoring - Configuration Health Monitoring for more detailed information on how to view cloud configuration health.
To view the application statistics on the Monitoring Session Statistics page, click View Monitoring Session Diagram and click on the


