Volume Based License Usage Reports
The Volume-based License Usage report is a multipage report in PDF format. The VBL Usage report contains sections for the incoming traffic (raw usage) and all license bundles that are active during the period of the report.
| Section | Details |
|---|---|
| Volume Usage: Summary |
Note: The reason is to find the high-end usage disregarding exceptionally high values that are outliers (happening due to some extraordinary condition prevailing on the day), and hence not representative of the normal high end usage values. |
| Daily Usage | Graph that displays the daily usage details. |
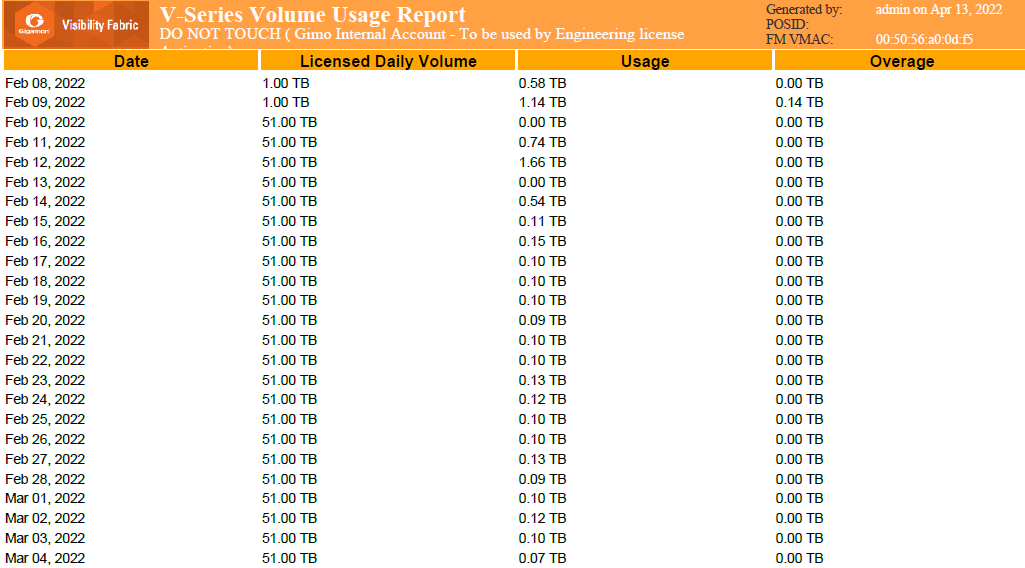
| Tabular format of the volume usage details |
Each section contains up to four pages. The first page contains a summary and a chart (with allowance as line chart and usage as bar chart) and the subsequent pages contain the allowance, usage and overage data for each day in the period. For example, if GigaVUE-FM has CoreVUE and NetVUE bundles imported, then report has the following sections:
|
The following figure shows an example for the Volume Based License Usage report.