Display the System Health Statistics
Use the show system-health command to display the system CPU and memory statistics for all of the nodes in the cluster.
Use the show system-health box-id <box id> command to display the system CPU and memory statistics for a specified node in the cluster.
The CPU utilization statistics display the CPU load average over the last 1 minute, 5 minute, and 15 minute intervals. The CPU usage is displayed over the last 5 secs, 1 minute, and 5 minutes. In addition, all the processes running in the cluster or a specified node in the cluster display the CPU utilization for the last 5 second, 1 minute, and 5 minute intervals. The process consuming the largest amount of CPU is displayed at the top.
The memory usage statistics display the total, used, and free amount of physical and swap memory available, as well as the memory usage for all the processes, with the process consuming the largest amount of memory displayed at the top.
Table 1: Statistics for CPU Utilization describes the statistics for CPU utilization:
Table 1: Statistics for CPU Utilization
|
Statistic |
Description |
|
CPU load average |
Measure of CPU utilization during the time interval of 5 seconds, 1 minute, and 5 minutes. This measure indicates whether the CPU is over-utilized or under-utilized. |
|
CPU usage |
Percentage of time during which the CPU is processing the operating system and programs. |
|
Core CPU (CPU1, CPU2, CPU3, and so on) |
Percentage of time spent by the core CPUs running the user space processes (user), running the kernel (system), and being in idle state (idle). |
|
Process |
Programs running in the specified node or all of the nodes in the cluster. The CPU statistics for the processes displays the Process ID (PID) and CPU usage. The statistics can be sorted by CPU usage. The data is displayed for the time interval of 5 seconds, 1 minute, 5 minutes, and total (in milliseconds). |
Note: When the node is restarted, the 5 seconds, 1 minute, 5 minute, and 15 minute statistics will not be exactly for the same intervals, until the full interval has elapsed and the history is available.
Note: When a new device is added to GigaVUE-FM, it takes one stats cycle for the above values to be reflected in the GigaVUE-FM GUI.
The following table describes the statistics for memory utilization:
Table 2: Statistics for Memory Utilization
|
Statistic |
Description |
|
Physical |
Total, used, and free amount of physical memory consumed by the specified node or each node in the cluster. |
|
Swap |
Total, used, and free amount of swap memory consumed by the specified node or each node in the cluster. |
|
Process |
Programs running in the specified node or all of the nodes in the cluster. The memory statistics for the processes displays process ID (PID), percentage of memory (%mem), RAM, and total memory used. The statistics can be sorted by %mem. The memory usage data is displayed in megabytes (Mb). |
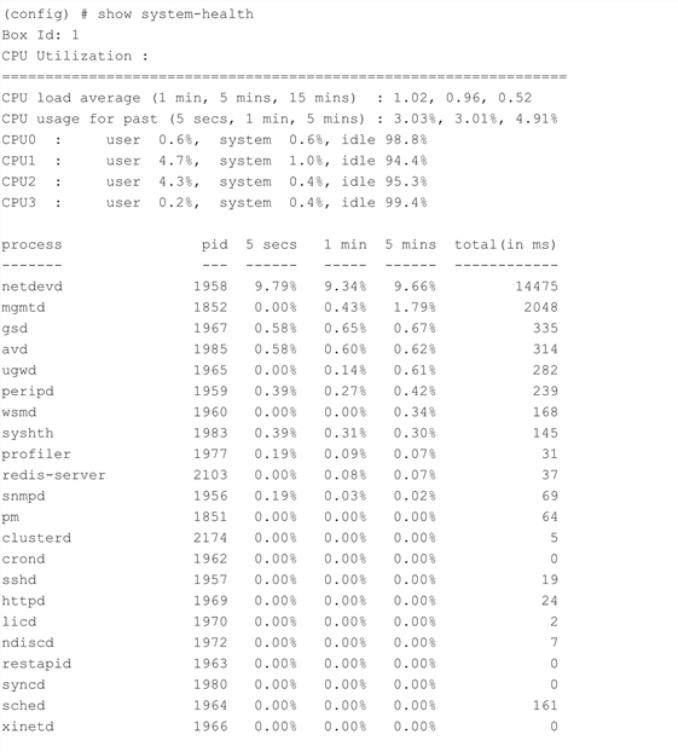
The following is an example of the show system-health command: