View Statistics
You can view the following inline SSL decryption statistics:
To display inline SSL session statistics, go to GigaSMART > Inline SSL > Session Statistics. Refer to Figure 1.

| Figure 118 | Inline SSL Session Statistics in FM |
To display the inline SSL summary details, go to GigaSMART > Inline SSL > Session Statistics, view the Summary section, then click Show Summary. There are four sections: Session Statistics, Performance Statistics, Policy Statistics, and Certificate Statistics.
To search the inline SSL session statistics, go to GigaSMART > Inline SSL > Session Statistics. Enter an IPv4 source leader in a bidirectional clock relationship (formerly master) or destination, an L4 port source or destination, or a host name on which to search the session statistics.
To display monitor statistics, go to GigaSMART > Inline SSL > Monitor Statistics.
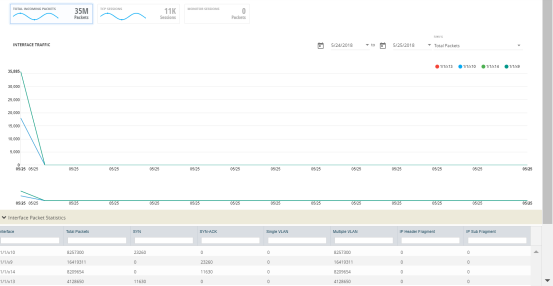
There are three sections. The first section, which has a graph for INTERFACE TRAFFIC and Interface Packet statistics, is displayed initially. To return to this display, click the small graph, TOTAL INCOMING PACKETS. Refer to Figure 2.

| Figure 119 | Inline SSL Session Monitor—Interface Packet Statistics |
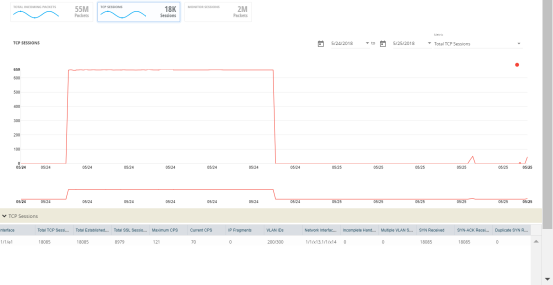
To display the graph and statistics for TCP Sessions, click the small graph, TCP SESSIONS. Refer to Figure 3.

| Figure 120 | Inline SSL Session Monitor—TCP Sessions |
To display Monitor Sessions, click the small graph, MONITOR SESSIONS. Refer to Figure 4.

| Figure 121 | Inline SSL Session Monitor—Monitor Sessions |
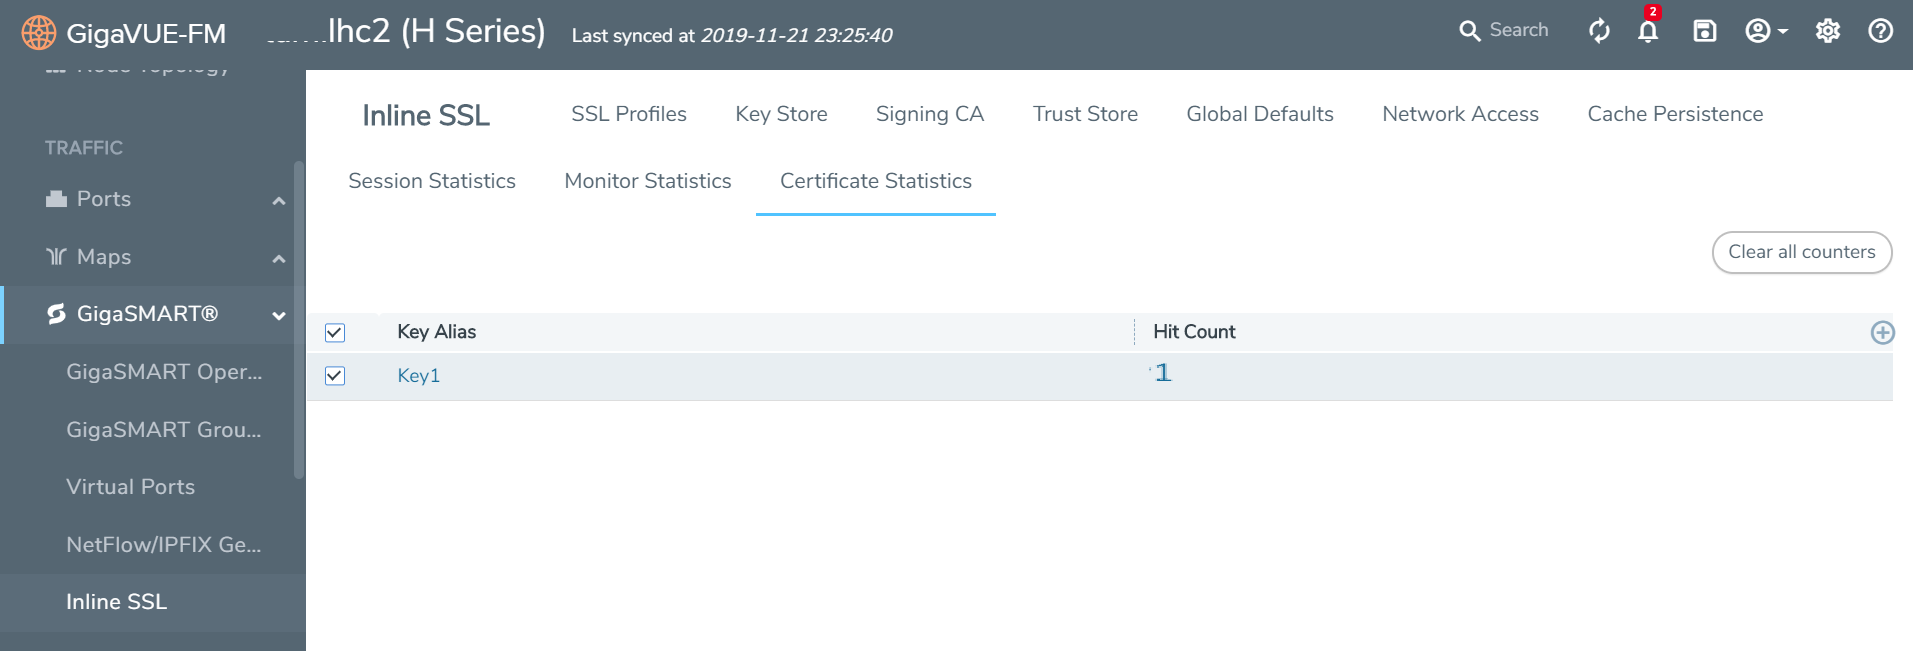
To view certificate statistics, go to GigaSMART > Inline SSL > Certificate Statistics. The page displays the hit count of each key store certificate and allows to track whether the certificate is actively used or not. The hit count is numbered only if the policy is set for decryption. If the policy is set to no-decryption or if the deployment is outbound, the hit count will not be considered.

| Figure 122 | Inline SSL - Certificate Statsistics |
Click Clear all Counters to clear the hit counter of all the certificates.


