View Device Logs
GigaVUE‑FM provides the ability to view logs for each device/cluster node. These logs list all the user events and enable Gigamon Technical Support to troubleshoot in case of any problems.
Note: Log streaming is supported on H Series devices only.
In addition to describing how to view logs, this section describes the following supported functionality related to understanding and configuring the Logs view.
| Arrange Columns in the Logs View |
To view the logs of a single node:
- On the left navigation pane, click on
 and select Nodes which displays the list of physical nodes managed by GigaVUE‑FM.
 - Select a GigaVUE node. The Single Node view displays overview statistics about the selected node.
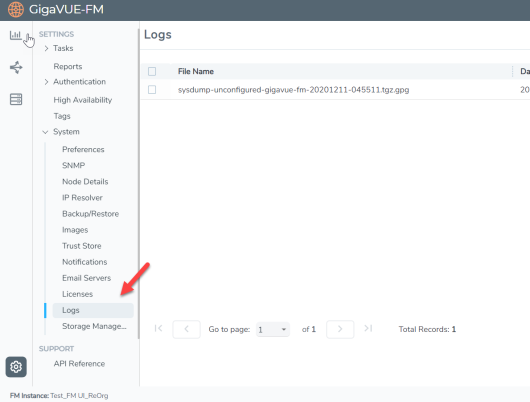
- In the left navigation pane, click Logs.

| Figure 57 | Overview of a Single Node |
The Logs view displays the latest log information for the selected GigaVUE node in table format.
| 1. | (Optional) Click the heading cell for any column to sort the list by that attribute. Refer to Arrange Columns in the Logs View for details. |
| 2. | (Optional) Click Filter to refine the list of logs by any of the available attributes. The Filter quick view displays the attributes of the logs. |
| a. | Enter a value in any of the available attribute fields to narrow the list of logs according to that value. |
|
Filterable Attributes |
Description |
|
Host Name |
Enter a hostname or partial host name. |
|
Device IP |
Enter a device IP address or partial address. |
|
Time |
Specify a start date and time and an end date and time to define a time period. IMPORTANT: Timestamps are shown in the time zone of the client browser’s computer and not the timezone of the node reporting the event. The timestamp is based on the correctly configured clock on the GigaVUE‑FM server and converted from UTC to the client computer’s configured timezone. |
|
Process |
Specify a process to target, such as clusterd, httpd, ntpd, restapid, snmpd, sshd, ugwd, or wsmd. Partial text entries are acceptable. Refer to Device Logging Processes |
|
Log Level |
Select one from the list of log levels, which are ranked by degree of severity. Refer to Device Logging Levels. |
|
Category |
Select a category of issue from the list of values, such as: High Temperature, Link, Packet Drop, or Resource Utilization. Refer to Device Log Categories. |
|
Priority |
Enter a priority number as defined by RFC 5424. |
|
Version |
Enter a version number. |
|
Type |
Select an event type from the list of values, such as CPU utilization high, memory utilization high, egress or ingress packet drop, and so on. Refer to Device Log Message Types. |
|
Affected Entity Type |
Select an affected entity type from the list of values. Options are: CPU, Memory, Port, or Optics |
|
Affected Entity |
Enter a specific affected entity |
| b. | Click Apply Filter to apply the filter on the current list of logs. |
The list of logs is now limited to the set matching your filter criteria.
| c. | To clear the filter, click the “Clear Filter” link above the table. |


