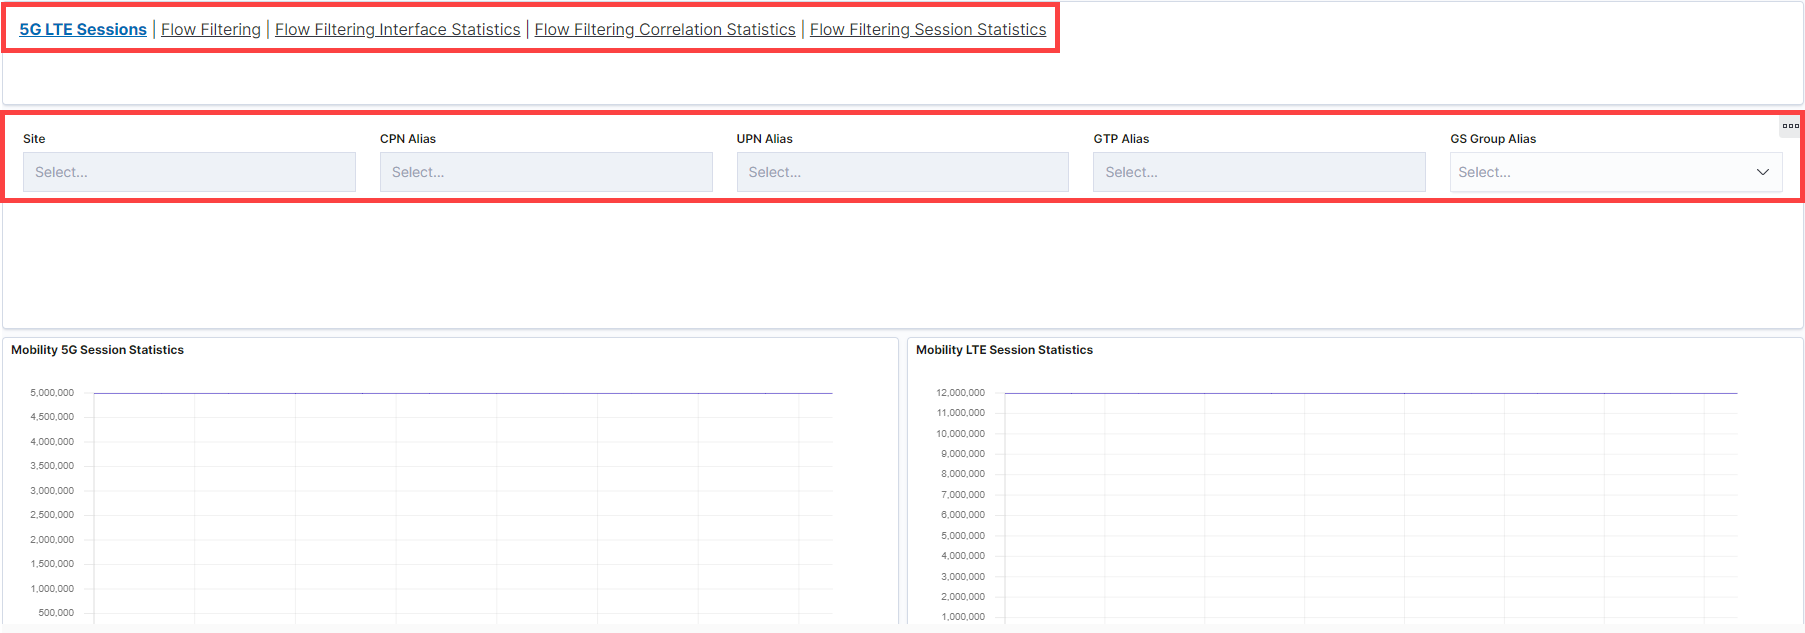
GigaSMART Mobility Session and Flow Filtering Dashboards
GigaSMART mobility session and flow filtering dashboards display flow filtering summary reports and statistics pertaining to the mobility solutions on an hourly, daily, weekly, or monthly interval. You can export the data from the dashboards page, and create your own flow ops visualizations for your required use cases.
How to Access the Dashboards
To access the Mobility Session and Flow Filtering dashboards:
- From the Dashboard menu: Go to
 -> Analytics -> Dashboards -> 5G LTE Sessions
 - From the Traffic menu: Go to
 -> Physical -> Orchestrated Flows -> Mobility -> Dashboard
 - From the Inventory menu:
Go to
 -> Physical -> Nodes ->GigaSMART Groups -> Report -> Flow Filtering
The following dashboards are displayed:
|
Dashboard |
Description |
Visualizations | Details |
|---|---|---|---|
| 5G LTE Sessions | Displays visualizations for 5G and LTE Session statistics | Mobility 5G Session Statistics |
Displays maximum aggregation of 5G numSessions, numSessions available and session capacity for all the GigaSMART groups pertaining to the mobility solutions against the time stamp.
|
| Mobility LTE Session Statistics | Displays maximum aggregation of LTE numSessions, numSessions available and session capacity for all the GigaSMART groups pertaining to the mobility solutions against the time stamp. | ||
| 5G Sessions by GSGroup Alias | Displays the maximum aggregation of all 5G statistics parameters for each GigaSMART group pertaining to the mobility solutions. The data columns are sortable and the user can find top N values by sorting across each field. | ||
| LTE Session by GSGroup Alias | Displays the Max aggregation of all LTE statistics parameters for each GigaSMART group pertaining to the mobility solutions. The data columns are sortable and the user can find top N values by sorting across each field. | ||
| Mobility Session No SFFP Match |
Displays Max aggregation of LTE and 5G num of SFFP No Match for all the GigaSMART groups pertaining to the mobility solutions against time stamp.
|
||
| Flow Filtering | Displays visualizations related to flow filtering statistics | Flow Filtering Statistics | Displays Max aggregation of controlTunnels, controlUserTunnels, controlOnlyTunnels and pendingSession for all the GigaSMART groups pertaining to the mobility solutions against timestamp. |
| Flow Filtering Statistics per GsGroup | Displays Max aggregation of of controlTunnels, controlUserTunnels , controlOnlyTunnels and pendingSession for each GigaSMART group pertaining to the mobility solutions. The data columns are sortable and the user can find top N values by sorting across each field. | ||
| Flow Filtering Interface Statistics | Displays visualizations related to flow filtering interface statistics | Flow Filtering Interface Statistics - Packets |
Displays Max aggregation of rxPkts, txPkts and droppedPkts for all the interface types in all GigaSMART group pertaining to the mobility solutions against timestamp.
|
| Flow Filtering Interface Statistics - Bytes |
Displays Max aggregation of rxBytes, txBytes and droppedBytes for all the interface types in all GigaSMART groups pertaining to the mobility solutions against timestamp.
|
||
|
Flow Filtering Interface Statistics - GTPC Packets
|
Displays Max aggregation of GTPC packets for all the interface types in all GigaSMART groups pertaining to the mobility solutions against timestamp. | ||
| Flow Filtering Interface Statistics - Packets Percentage | Displays Percentage for sum of tx and sum of dropped packets to sum of rx packets for all the interface types in all GigaSMART group pertaining to the mobility solutions against timestamp. | ||
| Flow Filtering Interface Statistics per Interface type | Displays Max aggregation of all Flow Filtering Interface stats for each interface type in each GigaSMART group pertaining to the mobility solutions. The data columns are sortable and the user can find top N values by sorting across each field. | ||
| Flow Filtering Correlation Statistics | Displays visualizations related to flow filtering correlation statistics. | Flow Filtering Correlation Statistics - Control |
Displays Max aggregation of control correlations statistics for all GigaSMART group pertaining to the mobility solutions against timestamp.
|
| Flow Filtering Correlation Statistics - User | Displays Max aggregation of user correlations statistics for all GigaSMART group pertaining to the mobility solutions against timestamp. | ||
| Flow Filtering Control Correlation Statistics per Control Message | Displays the Max aggregation of all Flow Filtering Correlation User stats for each GigaSMART group pertaining to the mobility solutions. | ||
| Flow Filtering Session Statistics | Displays visualizations related to flow filtering session statistics. | Flow Filtering Session Statistics - Sessions |
Max aggregation of sessions for all GigaSMART group pertaining to the mobility solutions against timestamp. |
| Flow Filtering Session Statistics - Tunnels | Max aggregation of tunnels for all GigaSMART group pertaining to the mobility solutions against timestamp. |
Refer to the following screenshot

Rules and Notes
- You cannot edit or delete these default dashboards. However, you can clone the dashboards and visualizations. Refer to the Create Custom Dashboards section for more details.
- You cannot visualize CLI configurations on these default dashboards.
- Flow Filtering Dashboards are not supported for 5G flow-ops report.
- You can use the following control visualizations to filter and visualize the data based on the following criteria:
- Site
- CPN Alias
- UPN Alias
- GTP Alias
- GS Group Alias


