About Flows
Flows provide the ability to view the traffic flowing from a network port that receives the traffic from a network TAP to the tool port that sends the traffic to the tools.
A flow is constructed by traversing backward starting from the egress tool port connected to the monitoring tools all the way up to the network ports that receive the traffic from a network TAP. If there are five egress tool ports sending the traffic out to the monitoring tools, there will be five flows displayed in the Flows page.
Figure 1 Flow - All Sites shows an example of a flow. It illustrates the network ports that receive the packets from different sources, a set of map rules that filter the packets, and the egress tool port that sends the packets to the monitoring tools. A flow name is determined by the egress tool port ID or alias. In this example, the flow name is SPEGE0070_Te5, which is the name of the egress tool port.
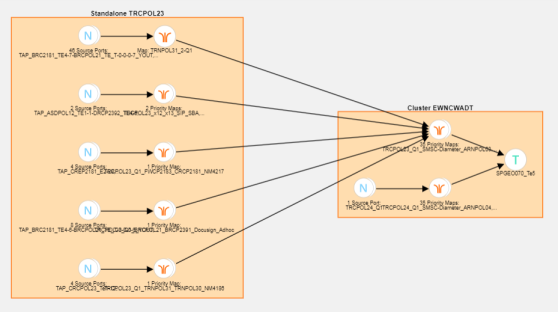
| Figure 45 | Flow - All Sites |
Figure 2 Standalone GigaVUE Nodes shows a number of GigaVUE nodes in the Topology page that are not connected to each other.
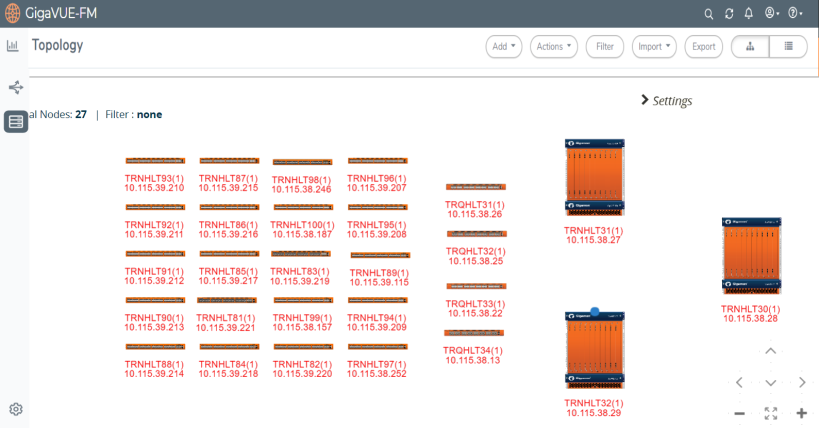
| Figure 46 | Standalone GigaVUE Nodes |
Each node seen in Figure 2 Standalone GigaVUE Nodes is represented as a separate flow in the Flows page.
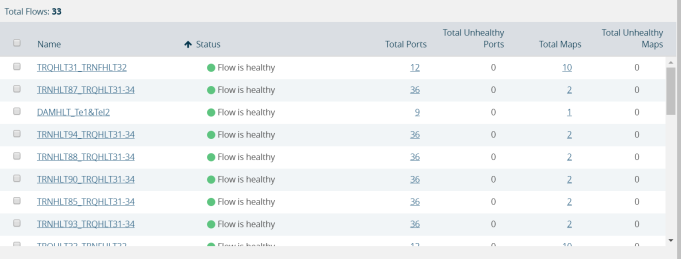
| Figure 47 | Flows Representing the Standalone Nodes |
When those GigaVUE nodes are connected using manual links or Gigamon Discovery links, the number of flows created depends on the number of egress tool ports sending the traffic out to tools. In this example, three flows are created as shown in Figure 2 Standalone GigaVUE Nodes.
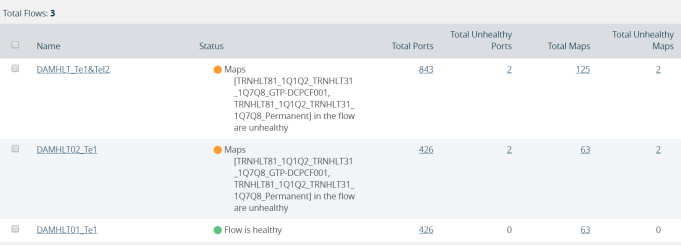
| Figure 48 | Healthy Flows - sample illustration of flows after connections are made |
Note: Gigamon Discovery is supported only from GigaVUE‑FM 5.2 and above.
Figure 1 Unhealthy priority Maps shows how unhealthy priority maps are illustrated in a flow view page.
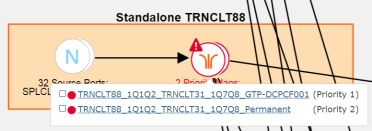
| Figure 49 | Unhealthy Maps |
Using flows, you can perform the following:
| Quickly identify the maps and ports that are unhealthy. |
| Quickly drill down the unhealthy map to investigate the cause of failure. |
| Export a list of unhealthy ports and maps. |
| View the data traffic across the flow, starting from the egress tool port that sends the traffic to the monitoring tool to the ingress network ports that receives the traffic from the network taps or span/mirror ports. The arrows in the flow indicate the path of the traffic flow. |
| View the pass all maps and the priority maps. A priority map set contains multiple maps configured with the same source leader in a bidirectional clock relationship (formerly master) ports in the port list. |
| Select multiple maps and view the statistics to verify if the traffic is flowing as expected. |
| Filter flows by Flow Name, Status or Cluster ID. |
| Update flows. |
A flow is automatically constructed every 24 hours, and flow health is calculated every 5 minutes. You can also manually trigger flow and graph calculations on demand.
The following components affect the health of a flow:
| Manual links or Gigamon Discovery links that connect the GigaVUE nodes. |
| Maps that are participating in the flow. |
| Health status of all the underlying components of a map such as GigaStream, port group, GigaSMART group, and vport. |
For information on flow health status, refer to Flow Health Status. For instructions on updating flows, see How to Update Flows.


