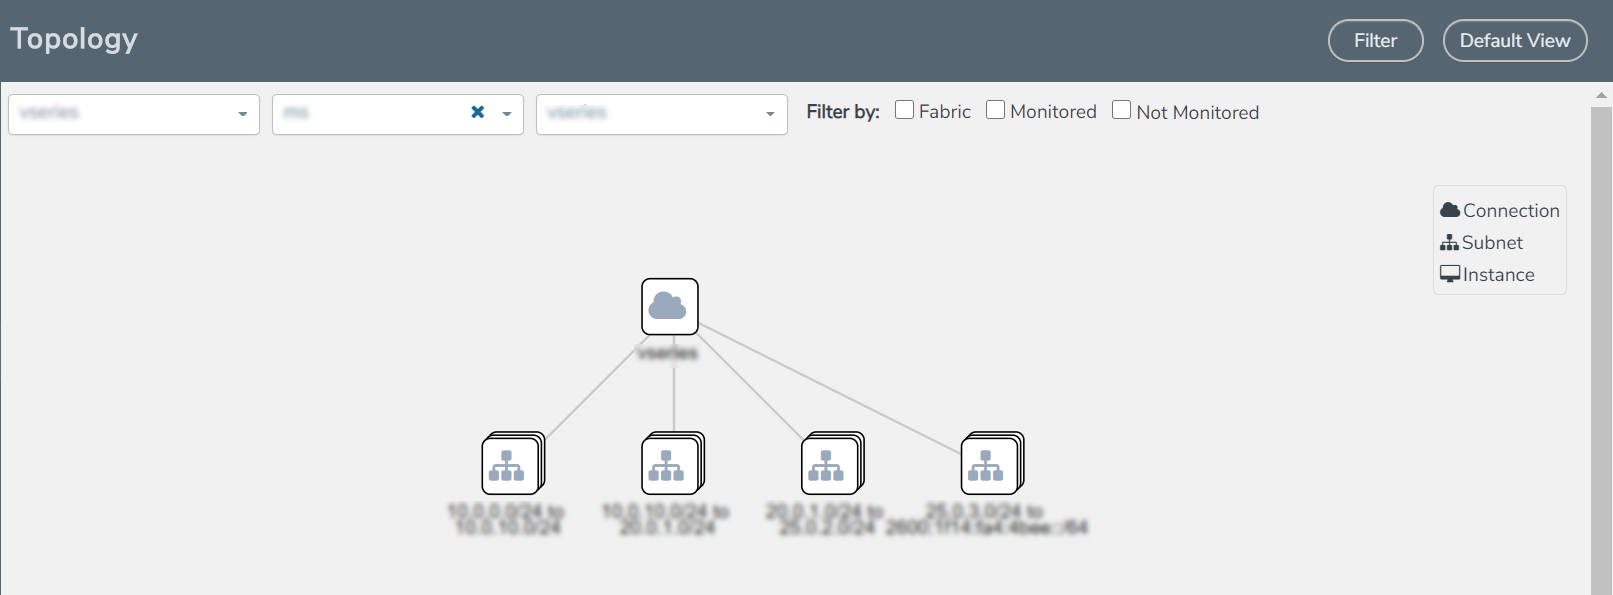
Visualize the Network Topology
You can have multiple connections in GigaVUE‑FM. Each connection can have multiple monitoring sessions configured within them. You can select the connection and the monitoring session to view the selected subnets and instances in the topology view.
To view the topology diagram in GigaVUE-FM:
- On the Monitoring Session page, select Topology tab. The Topology page appears.
- Select a monitoring domain from the Select monitoring domain... list.
- Select a connection from the Select monitoring session...list.
- Select a monitoring session from the Select connection... list. The topology view of the monitored subnets and instances in the selected session are displayed.
- (Optional) Hover over or click the subnet or VM Group icons to view the subnets or instances present within the group.
In the topology page, you can also do the following:
- Use the Filter button to filter the instances based on the VM name, VM IP, Subnet ID, or Subnet IP, and view the topology based on the search results.
- Use the Default View button to view the topology diagram based on the source leader in a bidirectional clock relationship (formerly master) interfaces of the monitoring instances.
- Use the arrows at the right-bottom corner to move the topology page up, down, left, or right. Click the Fit-to-Width icon to fit the topology diagram according to the width of the page.
- Use + or - icons to zoom in and zoom out the topology view.


