To deploy the monitoring session:
- Drag and drop the following items to the canvas as required:
- Ingress tunnel (as a source leader in a bidirectional clock relationship (formerly master)) from the NEW section
- Maps from the MAP LIBRARY section
- Inclusion and Exclusion maps from the Map Library to their respective section at the bottom of the workspace.
- GigaSMART apps from the APPLICATIONS section
- Egress tunnels from the TUNNELS section
- After placing the required items in the canvas, hover your mouse on the map, click the red dot, and drag the arrow over to another item (map, application, or tunnel).
Note: You can drag multiple arrows from a single map and connect them to different maps.
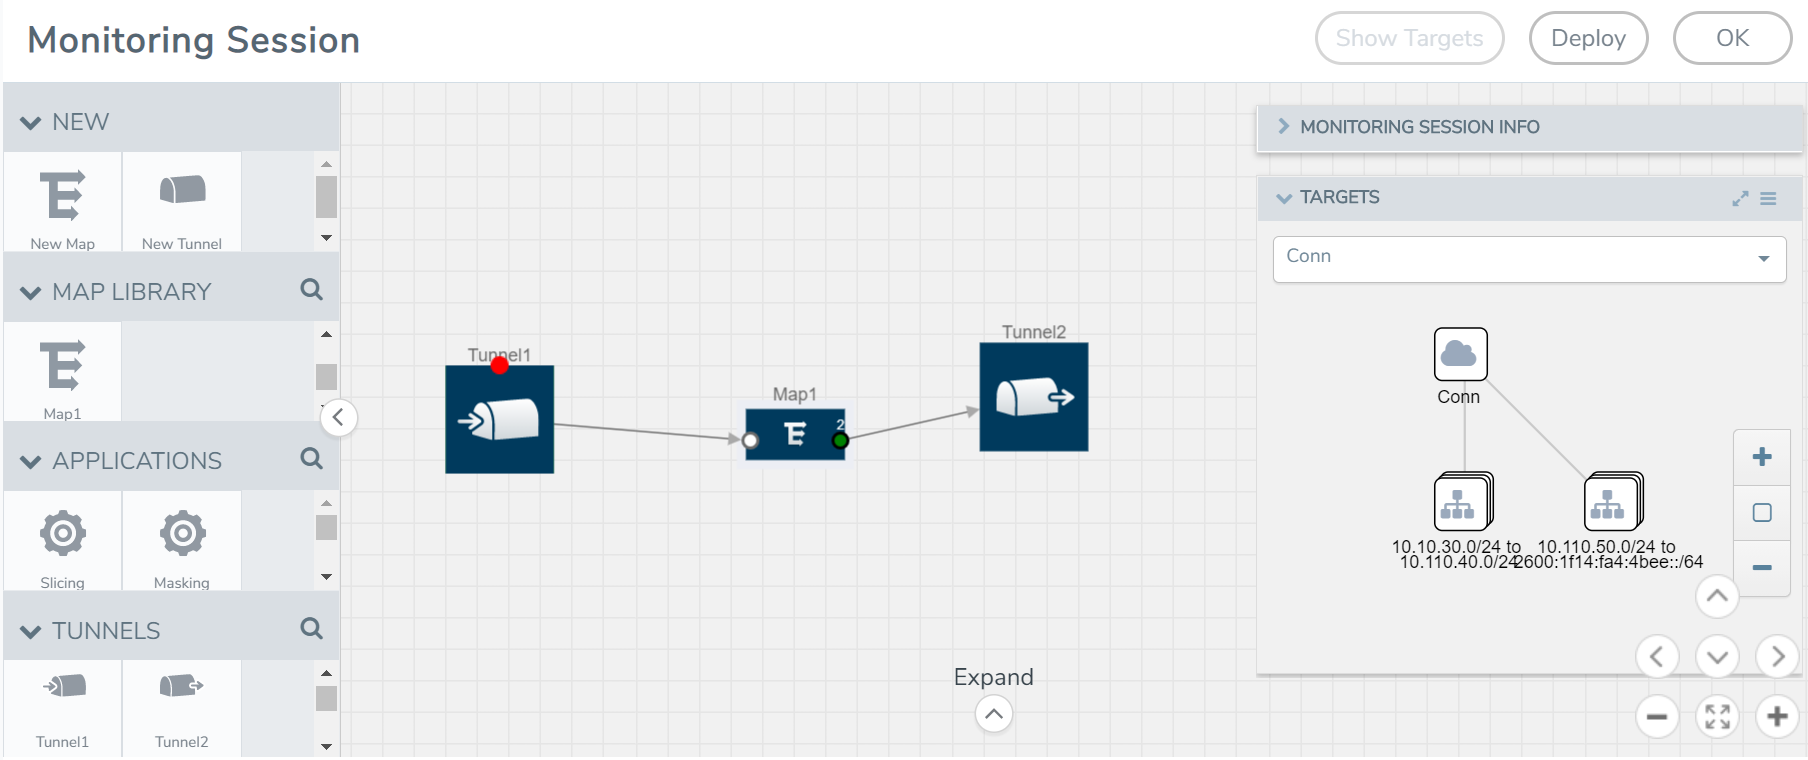
- (Not applicable for Tunnel traffic acquisition method) Click Show Targets to view details about the subnets and monitored instances. The instances and the subnets that are being monitored are highlighted in orange.
- Click Deploy to deploy the monitoring session.
The status is displayed as Success in the Monitoring Sessions page. The session is successfully deployed on all the V Series nodes. Click on the status link in the Status column on the Monitoring Session page to view the Monitoring Session Deployment Report.
When you click on the Status link, the Deployment Report is displayed.
If the monitoring session is not deployed properly, then one of the following errors is displayed in the Status column.
- Partial Success—The session is not deployed on one or more instances due to V Series node failure.
- Failure—The session is not deployed on any of the V Series nodes.
The Monitoring Session page also has the following buttons:
|
Button |
Description |
| Undeploy | Undeploys the selected monitoring session. |
| Clone | Duplicates the selected monitoring session. |
| Edit |
Opens the Edit page for the selected monitoring session. Note: In case of an error while editing a monitoring session, undeploy and deploy the monitoring session again.. |
| Delete | Deletes the selected monitoring session. |


