View the Application Intelligence Dashboard
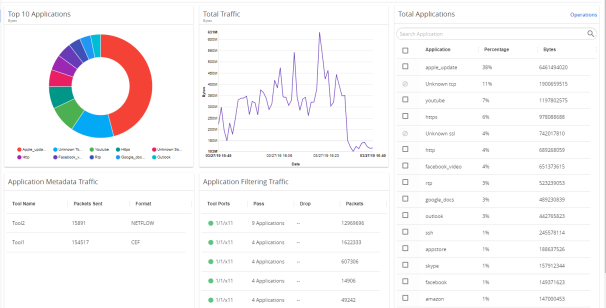
After creating the Application Intelligence Session, you can monitor the applications in the network by the reports displayed in the Dashboard as shown in Figure 1:

|
Figure 2
|
Application Intelligence Dashboard |
Application Intelligence Dashboard displays the following metrics:
|
■
|
Top 10 Applications: You can view a graphical representation of top 10 applications running in the network based on the metrics. When you hover over the Pie-chart, GigaVUE‑FM shows the application name in the network. The legend for the Pie-chart appears at the bottom. When you select a pie, you can view the corresponding data highlighted in the Total Applications table. |
|
■
|
Total Traffic: You can view the total traffic of the network represented in the linear form of a graph. |
|
■
|
Total Applications: You can view the applications and their bandwidth in the network. You can also select the required application for filtering and exporting metadata by using the Operations field. In the application list, when the following terms appears, it refers that the application is not available in the Application Intelligence look-up table: |
|
o
|
unknown — unknown application name and protocol |
|
o
|
unknown-TCP — unknown application name that belongs to TCP flow. |
|
o
|
unknown-HTTP —unknown application name that belongs to HTTP flow. |
|
o
|
unknown-UDP —unknown application name that belongs to UDP . |
|
o
|
unknown-SSL —unknown application name that belongs to SSL flow. |
|
■
|
Application Filtering Traffic: You can view the statistics of the applications that are filtered in the tool ports in the dashboard after creating an application filtering intelligence session for a device. You can view the number of applications that are dropped and passed through for the Application Filtering Traffic. |
|
■
|
Application Metadata Traffic: You can view the details of the Tool Name and the Format in which the metadata of the application is exported. |
GigaVUE‑FM enables you to view the above metrics for a particular period by selecting the date and time from the dashboard. You can also choose to view the graphs in the dashboard for the metrics in bytes, packets or flows. To view the metrics in bytes, packets or flows, click the gear  button in the right corner of the Application Intelligence dashboard.
Note: By default, you can view the metrics in the dashboard for the last one hour, if the period is not selected.

![]() button in the right corner of the Application Intelligence dashboard.
button in the right corner of the Application Intelligence dashboard. 


