View Maps and Ports
Figure 1 Unhealthy priority Maps shows how unhealthy priority maps are illustrated in a flow view page.
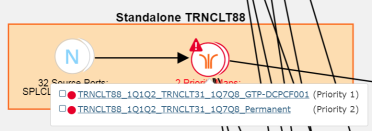
| Figure 54 | Unhealthy priority Maps |
Figure 2 Unhealthy Pass-all Map shows how a pass-all map is illustrated in a flow view page.
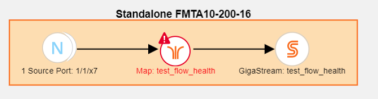
| Figure 55 | Unhealthy Pass-all Map |
A priority map set as illustrated in Figure 1 Unhealthy priority Maps can contain one or more maps configured with the same source ports. The health of this map is determined by the aggregated health of the priority maps in the map set. Sometimes, this map might be unhealthy because a map that is not participating in the flow is unhealthy. The overall health status of a flow is determined based on the aggregated health of all the maps that are involved in the flow.
There are two ways to view the total number of maps and ports that are healthy and unhealthy.
| In the Flows page, click the total number of ports, unhealthy ports, total maps, and total unhealthy maps to view detailed information about the maps and ports involved in the respective flow. |
| Click a flow in the Flows page. In the Summary tab, click the Related Ports, Total Unhealthy Ports, Related Maps, and Total Unhealthy Maps links to view detailed information about the maps and ports involved in the selected flow. |


