Redistribute traffic to one or more available tool ports
This section describe the tasks associated with redistributing traffic flow from one tool port to another available tool port.
Add Devices
| 1. | Add a new tool and indicate the Max Throughput and Storage Capacity the tool will dedicate to Gigamon ports. |
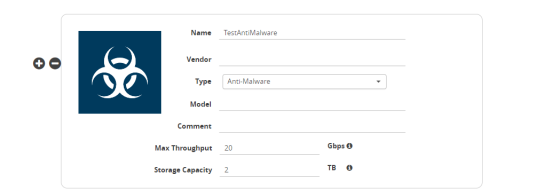
| 2. | Enter the following information for the node: |
| Name—the name of the node. |
| Vendor—the node’s manufacturer. For Gigamon nodes, you cannot edit this field. |
| Model—the model number of the node. |
| Description—optional description or additional information about the node. |
| Max Throughput - the maximum throughput traffic currently being sent to this tool. |
| Storage Capacity - the total processing capacity dedicated to all Gigamon ports physically connect to the tool. |
Note: This field is not displayed when selecting a device type Network.
The information entered for the node displays when hovering over the icon on the topology. Also, the type selected determines the icon.
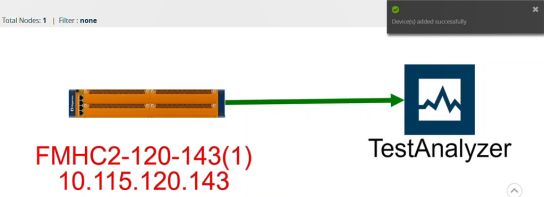
| 3. | Create a link from the Gigamon device to the new tool you created in Step 1 and provide the Gigamon ports that are connected to the new tool you created. |
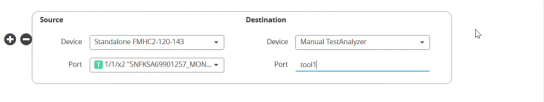
| 4. | Add the Device links Source and Destination port details. |
| 5. | Click Submit. |
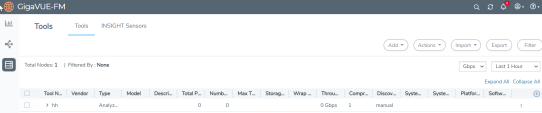
| 6. | From Physical > Tools to display the Tools page with new tool you created in first Step. |

The Tools page displays the available Tools in your network topology, including the tool you created
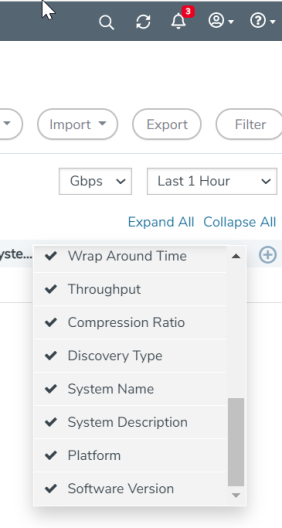
| Use the metrics drop-down to view the traffic throughput in Mbps or Gbps. |
| Use the Last time drop-down to select and view the tool port traffic for a specific time period. |
Redistribute Traffic to Another Port
Traffic that may be problematic for one tool port can be moved and redistributed to another tool port. Using the Tools page you can list the total traffic flowing to the tool from the Gigamon ports that are connected to the tool. The Tools page will help you analyze the traffic for redistribution by sending or duplicating it to another port or tool.
Example: Redistribute Traffic to Another Port
Below
|
Task |
UI Steps |
||||||||||||||||||
|
Add a new tool and indicate the Max Throughput and Storage Capacity the tool will dedicate to Gigamon ports. |
Enter the following information for the node:
Click in the Type field to select the icon for this node. Click Next. The system returns to the Topology, where the new node appears on the page. |
||||||||||||||||||
|
Create links between Gigamon devices and manual device. Based on the number of incoming links to tool, total traffic per port, max throughput and storage capacity, the wrap around time and current throughput % is calculated. |
Note: When adding more than one link between two nodes, both Source and Destination must contain information in the Port field. Click Submit. |
||||||||||||||||||
|
Use the Tools page detail views to analyze current traffic flows to tool ports. Use the Max Throughput and Storage Capacity data to help determine if any tool port receiving traffic is near or at capacity. Users can identify any available tool port to redistribute traffic. |
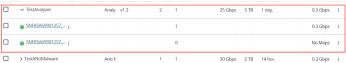
Select one of the ports receiving traffic. Expand a port to see which maps are sending traffic to that port.
Select Actions> View Details.
From the Details pane you can view the traffic flow for each tool port. Here you can determine if a tool port is at or near capacity and decide if you want to move it to another port with availability and linked to the device.
|
||||||||||||||||||
|
Redistribute traffic flow from one tool port to another available tool port. Replace an existing port with another port that is currently linked to the end tool. |
From the Tools page expand a port to view which maps are sending traffic to that port. Select a Device Select a different map from the current map that is at or near capacity to send traffic. Click Tools> Actions> Edit - Enter information for the node as you did in the first task. - Add the Device links Source and Destination port details. Click Submit. The tools page shows the available tool port with the new traffic flow data. |
is an example of Redistributing Traffic to Another Port.Viewing Traffic Flow
View Traffic Flows
To view tool port traffic flow, do the following.
| 7. | On the left navigation pane, click on  navigate to Physical >Flows. Flows for all nodes in your network topology displays based on the filter parameters. You can change the display of the flow details by clicking the Filter button and modifying the filter parameters. navigate to Physical >Flows. Flows for all nodes in your network topology displays based on the filter parameters. You can change the display of the flow details by clicking the Filter button and modifying the filter parameters. |
| 8. | Click the name of the node to display the flow. |
View Tool Port Details
To view Tool Port Details:
| 9. | On the left navigation pane, click on and under Physical > Tools. A listing of all the tools displays. |
| 10. | Select a device. |
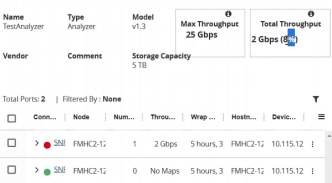
| 11. | Click Actions > View Details. |
| Max Throughput - Sum of all port’s throughput connected to the tool device. |
| Current Throughput% - Total throughput / Maximum Through (User entered data for that Tool). |
| Wrap Around Time - Total Storage (User entered data for the Tool)/Current Throughput. |
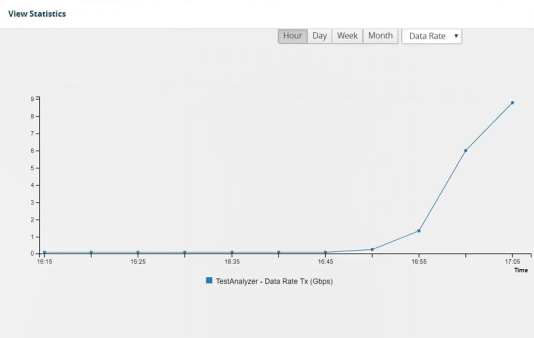
View Tool Port Statistical Graph
To view Tool Port Statistical data:
| 12. | On the left navigation pane, click on from Physical > Tools. |
| 13. | Select a device. |
| 14. | Under the Actions drop down, select View Statistical Graph. The statistics is an aggregated graph of all the ports connected to the tool device. |