Links
Links between nodes are shown as arrows between nodes. The links are automatically created for nodes in clusters and connections to discovered neighbor nodes. The links are also discovered through LLDP, CDP, or Gigamon Discovery. The LLDP links represent a Gigamon-to-LLDP connection. The CDP links represent a Gigamon-to-CDP connection. The Gigamon Discovery links represent a Gigamon-to-Gigamon connection. The thickness of the link indicates the link's bandwidth. A dashed line represents an aggregated link. Inside a cluster container, a dashed line represents a GigaStream stack link between nodes and the tool-tip for the link will provide information about the GigaStream. For more information about link aggregation, refer to Aggregated Links.
Link State
Links between nodes in the topology have a color to indicate the link’s current state. The link state is also identified in the tooltip information that displays when clicking on a link. The following are the link state colors and their meanings:
|
Color |
Link State |
|
Green |
Up (connected) |
|
Red |
Down (disconnected), unreachable, or unknown The link state will be Red (or down) in an aggregated link if all the link states of the associated links of the aggregated link are down. In an aggregated link, the link state is unknown if all the link states of the associated links in the aggregated link are unknown. |
|
Amber |
Warning This link state only applies to aggregated links. If any one of the links in the aggregated link is down or unknown, the link state is rendered as amber. |
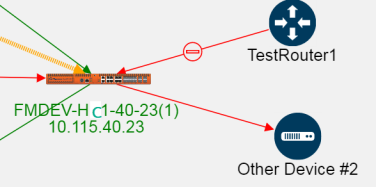
Red indicates that the link is either down or its status is unreachable. When the link is down, a stop icon also displays on the link. For example, in the following figure, the link color (red) and the stop icon on the link from TestRouter1 to the GigaVUE‑HC1 indicates that it is down. The link from the GigaVUE‑HC1 to Other Device #2 is unknown because it is red and there is no icon on the link.
When the link status is between two Gigamon nodes, the link status is determined as follows:
| If the port for the link associated with the node is up, the link status is up or connected (green). |
| If the port for the link associated with the node is down or unknown, the link status is down or disconnected (red) and a stop icon is displays on the link. However, if there is no stop icon, the status is unknown. |
When the link is between a Gigamon node and an LLDP, CDP neighbor, another GigaVUE node, or a manually created node, the link status is determined by the link status of the Gigamon node as follows:
| If the port status is up, the link status is connected (green). |
| If the port status is down or unknown, the link status is disconnected (red). |
Link Health State
In addition to a link state, links have a health state based on link utilization. The link’s health state is computed only when the link state is up. The health status is indicated in the tooltip when clicking on a link, which shows an LED bubble. The colors indicated the following
|
Color |
Link Health State |
|
Green |
Normal utilization. |
|
Red |
The link is either underutilized or overutilized |
|
Amber |
At least one of the links in an aggregated link is either underutilized or overutilized. |
|
Gray |
Health state is not available. |
If the health state of the link is not within the normal range of utilization based on the low and high utilization thresholds, a warning icon displays on the link.
Link Utilization Thresholds
The health state of a link is based on the utilization of the link. The utilization thresholds are specified through the settings dialog. The threshold values apply to all nodes managed by GigaVUE‑FM. They should not be confused with port level thresholds.
To open the dialog, click Settings in the upper-right corner of the topology.
The Link Utilization Thresholds are as follows:
| Low—sets the lower limit of the utilization threshold. If the link’s utilization falls below the specified percentage, the link is considered underutilized. The default is 40 percent utilization for a low utilization threshold. |
| High—sets the upper limit of the utilization threshold. If the link’s utilization rises above the specified percentage, the link is considered overutilized. The default is 75 percent utilization for a high utilization threshold. |
| Interval—the time period (in minutes) over which the link utilization is measured. The time interval is used to determine utilization based on an average value of port utilization over the specified interval. The default is 15 minutes. |
| Utilization Overlay—Turns on/off the utilization warning icons. An icons appear on the link if it is either overutilized or underutilized. To turn on the overlay, slide the switch to on and click OK. Figure 1 Overutilization Overlay shows an example where the utilization overlay is turned on. The Utilization Overlay setting only applies to the current session. If you log out of GigaVUE‑FM and then log in again, the Utilization Overlay is set to off. |
| Figure 14 | Overutilization Overlay |
Aggregated Links
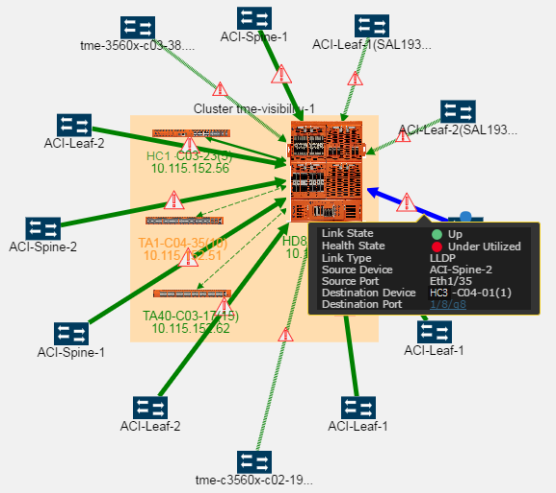
A node in the topology can have more than one link to another node. However, these links display in the topology as a single dashed line. In Figure 2, the link between the node tme-c3560x-c02-19 and the GigaVUE‑HC3 node in the cluster is an aggregated link. The link state or link health state of the links within the aggregation determine the state of the aggregated link. For more information, refer to Link State and Link Health State.
| Figure 15 | Aggregated Link |
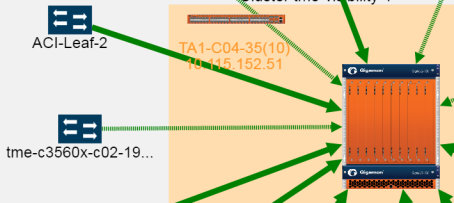
To view the links in the aggregation, right-click in the cluster container to open the context menu and select View Node Topology. Refer to Figure 3.
f
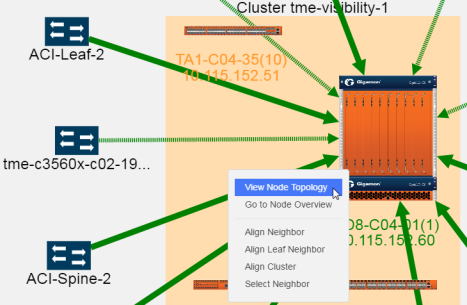
| Figure 16 | View Node Topology Selected |
Selecting View Node Topology, opens the Node Topology for the selected cluster, where the links are not aggregated. Figure 4 Node Topology shows the cluster in Figure 3 View Node Topology Selected as it appears in Node Topology with all the links unaggregated. For more information about Node Topology, refer to Node Topology.
| Figure 17 | Node Topology |
To return to the GigaVUE‑FM Topology page, right-click on the cluster or node to open the context menu and select View FM Topology.
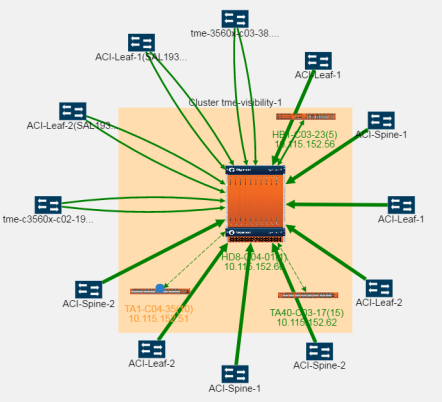
GigaStream
GigaStream links display in the topology as dashed lines within a cluster. Clicking on the link opens a tooltip that provides the source and destination GigaStream of the link. Figure 5 shows an example.
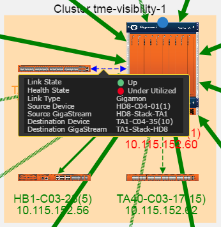
| Figure 18 | Tooltip for a GigaStream |
Link Details
To view details about a link, click on the link and select More Details from the context menu. A Link Details quick view opens with details about the link. If the link is aggregated, Link Details shows information for each link in the aggregation.
| Figure 19 | Link Details for an Aggregated Link |
Link Details provides the following information:
|
Field |
Description |
|
Source Devices |
The source nodes for the link. |
|
Source Type |
The type of source node: CDP, LLDP, Gigamon, or Manual |
|
Destination Devices |
The destination nodes for the link. |
|
Destination Type |
The type of destination node: CDP, LLDP, Gigamon, or Manual. |
|
Total Links |
Total number of links in the aggregation. |
|
Health State |
An LED bubble indicates the current health state of the port. Hovering over the bubble displays a tooltip with the current state of the link. For a description of the health states, refer to Link Health State. |
|
Source Port |
The details for the source port, such as the port ID of the link’s source port. The exact details vary depending on the type of node. |
|
Destination Port |
The details for the destination port, such as the port ID of the link’s destination port, alias (if any), admin and link status of the port, and the percentage of utilization displayed as a progress bar. The exact details vary depending on the type of node. |
GigaStream Stack Link Details
If the link is a GigaStream stack link connecting a leaf and a spine node, Stack Link quick view is displayed. The quick view provides stack link information and GigaStream status with details such as GigaStream alias and total number of ports.
The following table describes the parameters displayed in the GigaStream stack link quick-view:
|
Field |
Description |
|
Info |
Displays the stack link information such as the name of the stack link, component, and type. |
|
GigaStream List |
|
|
Alias |
Displays the stack GigaStream name. |
|
Type |
Displays the type of the port. |
|
GigaStream Status |
Displays the status. |
|
Member |
Displays the ranking of the GigaStream member in the stack GigaStream link. The number ‘1’ represents the first GigaStream member configured. The number ‘2’ represents the second GigaStream member configured. |
|
Details |
Displays the health status of the stack link. |
|
Total Ports |
Displays the total number of ports that connects the nodes. |


