View the Details of an Application Intelligence Session
To view the details and the statistics of a session, do the following steps:
|
1.
|
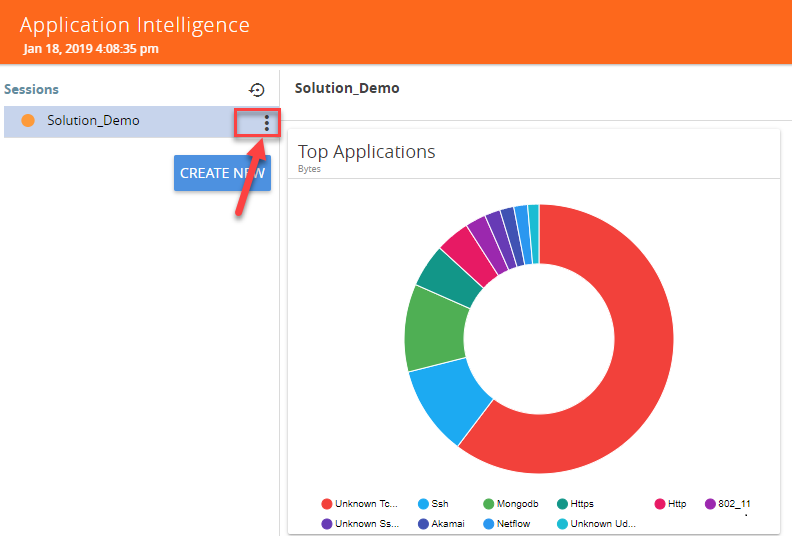
Select the session from the Application Intelligence Sessions pane for which you need to view the sessions details, health status and statistics, and click the ellipsis as shown: |
|
2.
|
Select View Details from the drop-down list. |
You can view the Monitoring Details, Destination Settings, Source Traffic, and Application Filtering-Destination Traffic, and Application Metadata-Destination Traffic in the Details page.
Note: You can edit the Source Traffic, Application Filtering-Destination traffic, and Application Metadata-Destination Traffic from the view details window.
|
3.
|
Click Troubleshoot to view the current statistics and health status of components associated with the solution. |
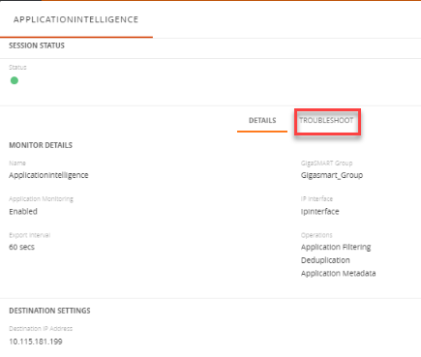
The details of the components that can be viewed for a solution are shown in the following table:
|
Components
|
Details of Components
|
|
Source Traffic
|
|
|
GigaSMART
|
|
|
Application Monitoring
|
|
|
Application Filtering -Destination Traffic
|
|
•
|
Applications and Advanced Rules |
|
•
|
GigaSMART Operation (GSOP) |
|
|
Application Filtering
|
|
•
|
Application Session Filtering
|
|
|
Application Metadata
|
|
The troubleshooting page has a flow diagram representing the components associated to the solution. You can also click on the blocks in the flow diagrams to view the details of the corresponding components.
To learn more about the color indication and the health status of a solution refer to
View the Health Status of a Solution.


