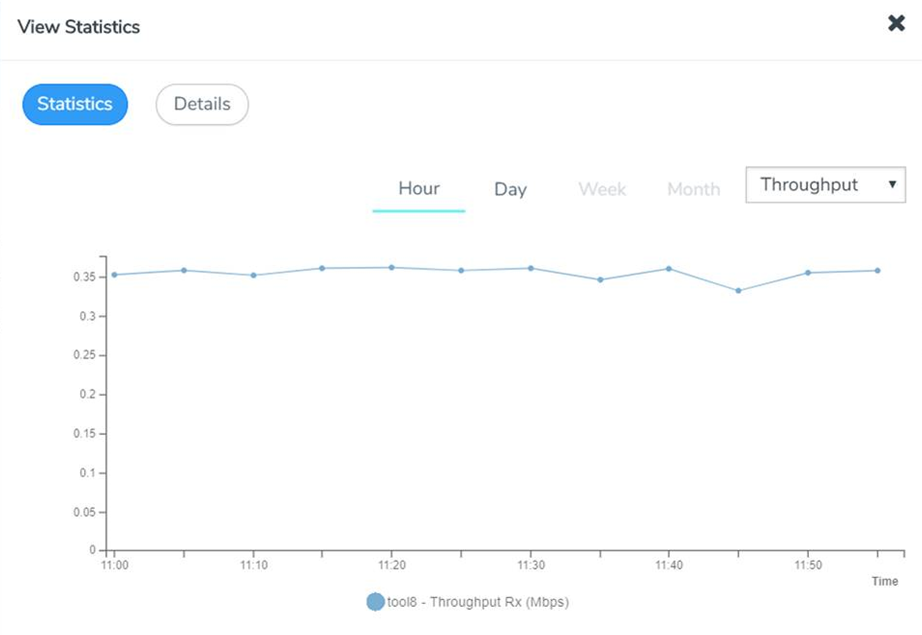
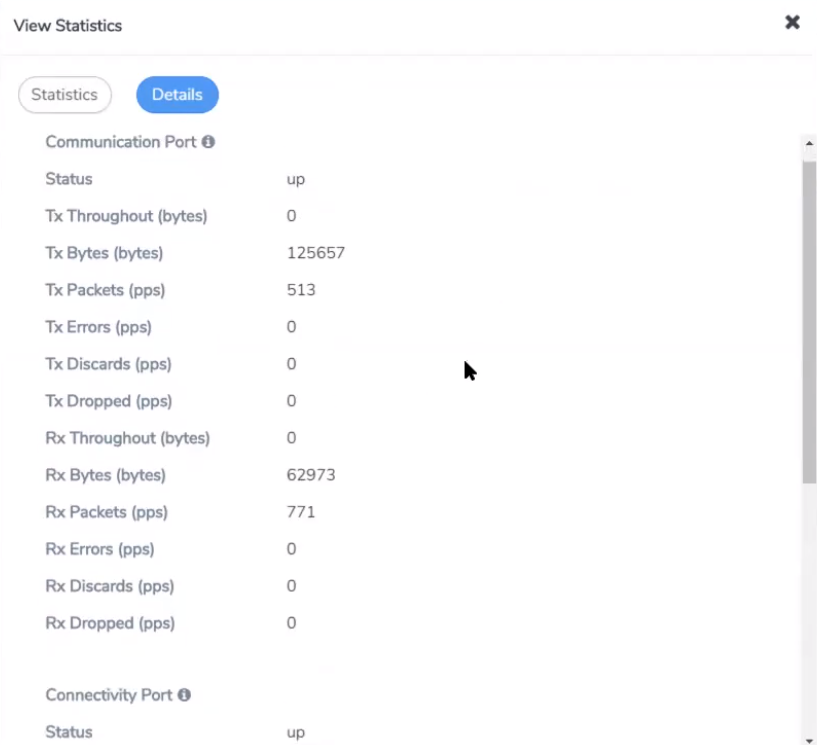
GigaVUE-FM polls the ThreatINSIGHT sensor to obtain statistics for the following types of counters:
| • | Total Data—The total data received and analyzed by the ThreatINSIGHT sensor. |
| • | Total Packets—The number of packets received and analyzed by the ThreatINSIGHT sensor. |
| • | Throughput—The amount of data successfully processed by the ThreatINSIGHT sensor. This is the default counter. |
| • | Errors—The number of packets received with errors. |
| • | Discards—The number of packets discarded by the ThreatINSIGHT sensor. |
| • | Dropped—The number of packets dropped by the ThreatINSIGHT sensor. |
The counters are aggregated by hour, day, week, or month.
To view the statistics in GigaVUE-FM, go to the Tools page, select the ThreatINSIGHT sensor, click the vertical ellipsis, and then select View Statistics Graph.

Note: You cannot clear these counters.
Use the Details tab in the View Statistics page to view the diagnostics statistics of the ThreatINSIGHT sensor's Communication port (management port) and Connectivity port (stack port - eth2). These statistics gets refreshed every 10 seconds.


