Traffic Comparison By Tags
The Traffic Comparison By Tags widget allows you to compare the aggregated traffic flowing through the list of ports associated to tags. You can choose to view up to four traffic comparisons in a single widget. You can create as many Traffic Comparison By Tags widgets as necessary in the selected profile and provide a customized name for each widget. The customized name helps you to differentiate multiple traffic comparison widgets in a single profile.
In this example, there is traffic flowing from GigaVUE-TA10 to GigaVUE-HC2. You can group the tool ports in GigaVUE-TA10 and create a tag as T A_TOOL. Then, you can group the network ports in GigaVUE-HC2 and create a tag as HC2-NETWORK. Refer to Figure 1 Example for Traffic Comparison By Tags Widget.
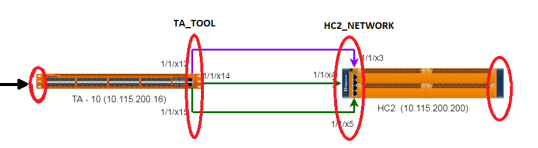
| Figure 26 | Example for Traffic Comparison By Tags Widget |
Using the Traffic Comparison By Tags widget, you can compare the egress traffic passing through the ports associated with T A_TOOL with the ingress traffic passing through the ports associated with HC2-NETWORK, and quickly analyze if there is any packet loss associated. Refer to Figure 2 Traffic Comparison By Tags
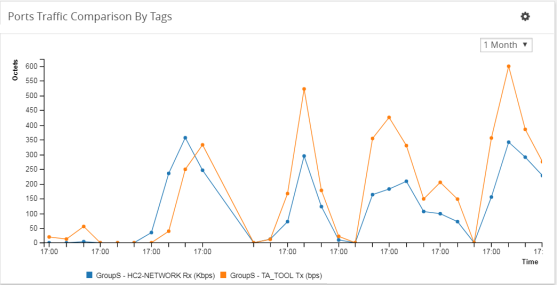
| Figure 27 | Traffic Comparison By Tags |
The Traffic Comparison By Tags widget also allows you to choose just the egress traffic passing through the ports associated with T A_TOOL and view the graph.
The following statistics can be viewed for physical ports and GigaSMART:
|
Traffic Type |
Statistics |
|
Physical Ports |
Data Rate Packet Rate Packet Errors Packet Discards Packet Drops Port Utilization |
|
GigaSMART |
Data Rate Packet Rate Packet Drops Packet Errors Packet Buffer Packet Terminated |
The aggregated traffic comparison is displayed as a graph. You can choose to display the data over a day, an hour, a week, or a month. However, when you select a week or a month, the time period is not persisted. The data is defaulted to 1 day when you navigate away from the Physical Dashboards page and then return to the page. Click the notification icon at the top of the window and view the alarms and notifications displayed (refer to Figure 3 Notifications):
![]()
| Figure 28 | Notifications |
Hovering the mouse over the lines in the graph displays the tag name, traffic direction, and traffic flow (Mbps).
To configure the Traffic Comparison By Tags widget:
| 1. | Click Dashboard on the top navigation bar. |
| 2. | On the Physical & Virtual dashboard page, select the profile in which you want to add the widget. |
| 3. | Click Add New Widget. The Add New Widget window is displayed. Refer to Figure 3 Add New Widget. |
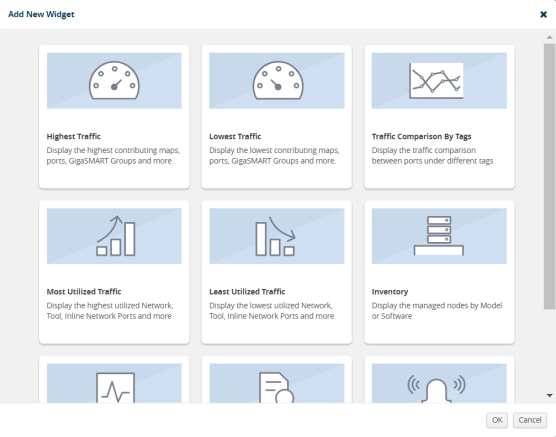
| Figure 29 | Add New Widget |
| 4. | In the Add New Widget window, select Traffic Comparison By Tags widget and click OK. The Traffic Comparison by Tags configuration window is displayed. Refer to Figure 5 Traffic Comparison By Tags Configuration. |
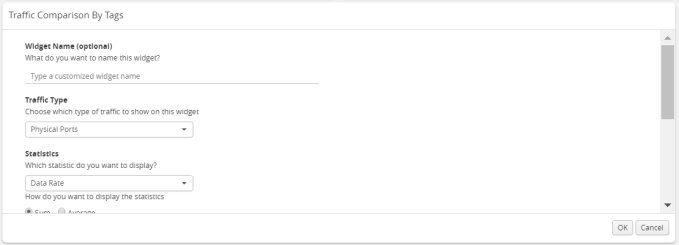
| Figure 30 | Traffic Comparison By Tags Configuration |
| 5. | (Optional) In the Widget Name box, enter a customized name for the widget. Customized name helps to differentiate multiple traffic comparison widgets in the same profile. |
| 6. | From the Traffic Type drop-down list, select one of the following traffic types: |
| • | Physical Ports |
| • | GigaSMART |
| 7. | From the Statistics drop-down list, select the type of statistic to view in the comparison graph. |
| 8. | Select Sum or Average to determine the way to display the statistics. |
| 9. | In Tag Items, select two or more tags to compare. |
| a. | For Traffic 1, select the tag name and tag value from the drop-down lists. |
| b. | Select Ingress (Rx) or Egress (Tx) to determine the traffic direction. |
| c. | Repeat step a and step b to select the next traffic for comparison. |
| 10. | Click OK. |


